FieldVision

See the Diagnosis. Understand the Reasoning.

FieldVision is an explainable crop diagnosis system that identifies likely plant conditions, shows what parts of the image influenced the result, and adds crop-specific knowledge to help users interpret the diagnosis.

How It Works

From Image to Informed Diagnosis

FieldVision does not just return a label. Every result passes through three connected layers that help users move from a crop image to an interpretation they can act on.

Step 1 · Prediction
Identify the Condition
Likely conditions with confidence scores
Step 2 · Explanation
Show What Influenced It
Visual overlay of key image regions
Step 3 · Knowledge
Interpret the Result
Crop-specific diagnostic context

Supported Crops

Three Crops, One Consistent Approach

FieldVision applies the same three-layer approach across rice, tomato, and maize. Each crop uses a model trained specifically for its disease patterns and a knowledge base tailored to its conditions.

Rice

Rice Disease Detection

Ten rice leaf conditions, including bacterial and fungal diseases.

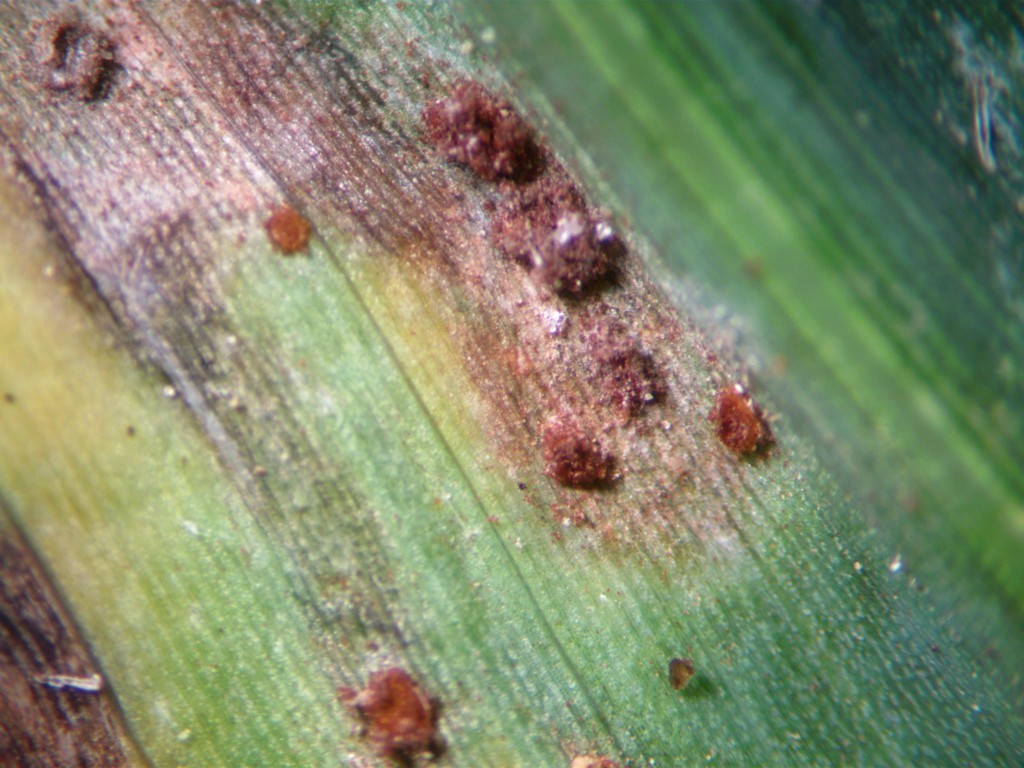
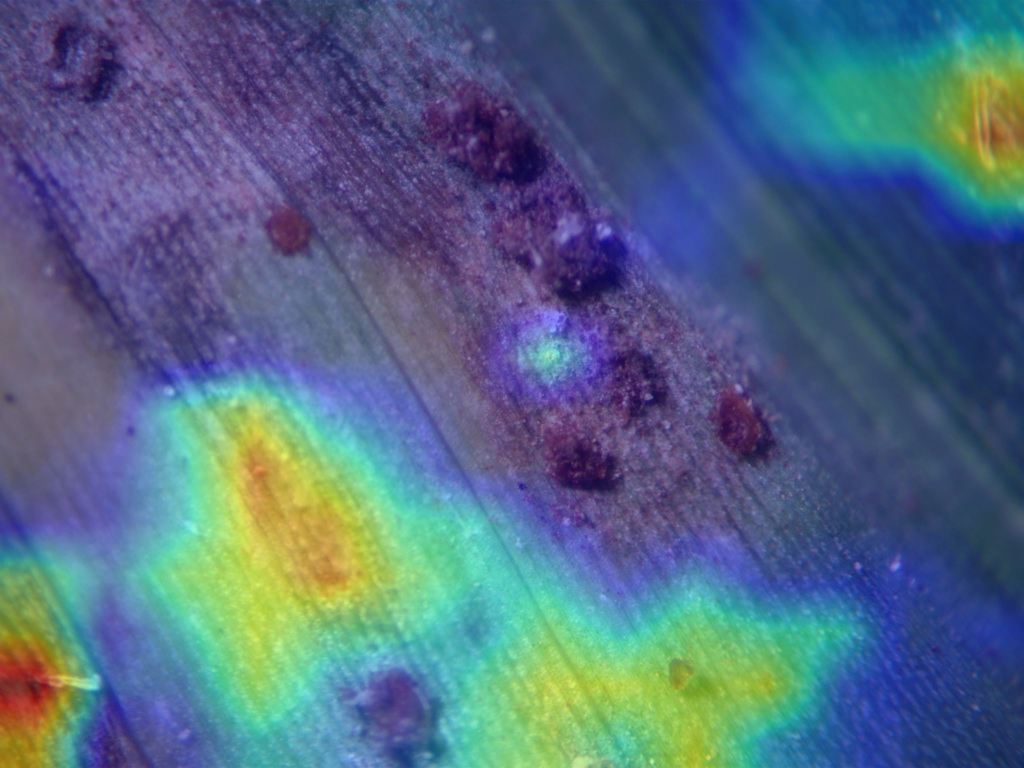
Upload a rice leaf image and FieldVision identifies the most likely condition from ten known classes, highlights where the model focused on the leaf, and adds agronomic context to help you interpret what you are seeing.

Crop: Rice 10 conditions Status: Pilot & research use
  • Covers bacterial leaf blight, brown spot, leaf blast, leaf scald, narrow brown spot, neck blast, rice hispa, sheath blight, tungro, and healthy leaves.
  • Returns the most likely condition with a confidence score so you know how strongly the model favors the result.
  • Visual overlay highlights which areas of the leaf drove the prediction.
  • Agronomic notes help you understand what the predicted condition typically looks like and what to look for in the field.
Tomato

Tomato Disease Detection

Ten tomato leaf conditions, including viral diseases and pest damage.

Upload a tomato leaf image and FieldVision returns the most likely condition, a visual explanation of what influenced the result, and crop-specific knowledge to help you decide what to do next.

Crop: Tomato 10 conditions Status: Production-ready
  • Covers healthy, leaf mold, target spot, late blight, early blight, bacterial spot, septoria leaf spot, tomato mosaic virus, tomato yellow leaf curl virus, and spider mite damage.
  • Handles overlapping or subtle symptom patterns where individual lesions are small or mixed.
  • Visual overlay helps agronomists check whether the model is focusing on the right part of the leaf.
  • Diagnostic notes explain common look-alikes and what to consider before acting on the result.
Maize · Flagship

Maize Disease Detection

Ten maize leaf conditions, tuned for real field images.

FieldVision's flagship maize model is designed for field conditions: uneven lighting, partial occlusion, and mixed symptoms. It returns a prediction, a visual explanation, and structured agronomic knowledge — all in one result.

Crop: Maize 10 conditions Status: Live in FieldVision
  • Handles difficult real-field conditions including uneven lighting, partial occlusion, and mixed disease symptoms.
  • Visual overlays show whether the model is focusing on lesions, chlorosis, streaking, or other visible damage patterns.
  • Calibrated confidence scores help users assess how strongly the model favors a result before acting.
  • Connected to a maize-specific knowledge base covering symptoms, look-alikes, and agronomic context.

Side-by-Side View

What Each Crop Model Returns

This table focuses on what users see from each model: the types of conditions it detects, how the visual explanation behaves, and what agronomic knowledge is available per crop.

Aspect Rice Tomato Maize
System Role Foundation / baseline Proven architecture Flagship model
Model Type Compact convolutional network Deep residual convolutional network Hybrid convolution + attention
Crop Rice Tomato Maize
Detectable Conditions 10 classes (diseases + healthy) 10 classes (diseases + pest damage + healthy) 10 classes (diseases + pest damage + healthy)
Best Image Input Individual rice leaves in daylight with visible symptoms Close-up tomato leaf with clear focus; tolerates some background Maize leaf in field conditions, including uneven light and partial occlusion
What It Does Well Fast, efficient baseline; useful for pilots and benchmarking Handles overlapping or subtle symptom patterns Performs in difficult field conditions with mixed or partial symptoms
Field Validation Lab-tested with targeted field spot-checks Lab and field validation across multiple seasons Extensive field validation in African farms and trials
Typical Use Research, benchmarking, and early rice pilots Tomato advisory tools and partner projects Core maize diagnosis in FieldVision deployments
Update Cadence Updated when introducing new baselines Periodic updates from new data and partner feedback Ongoing with monitored rollouts and versioning
Visual Explanation Visual overlay on convolutional features Sharper overlay on deeper residual features Overlay combining local symptom detail and broader patterns

Internal architectures and training pipelines are not listed here. Behaviour, evaluation approach, and limitations are fully open for discussion.

Model Evaluation

Reading the confusion matrix

Every model is evaluated against held-out test data before deployment. The confusion matrix below shows class-level prediction accuracy — how often each disease is correctly identified versus confused with another. Diagonal dominance indicates strong per-class performance.

Disease classification confusion matrix — per-class accuracy of FieldVision's maize model

Confusion matrix — maize disease classification model

The Diagnosis Flow

What Happens When You Upload an Image

When a user submits a crop image, FieldVision processes it through three connected steps before returning a result. Each step contributes something distinct to the final output.

Step 1: Prediction

  • The image passes through a crop-specific vision model trained on that crop's known disease patterns.
  • The model returns the most likely condition from its known classes, along with a confidence score.
  • Confidence reflects how strongly the model favors one result over others — not whether the diagnosis is correct.

Step 2: Visual Explanation

  • A visual overlay is generated showing which areas of the image most influenced the prediction.
  • This helps users see whether the model focused on visible lesions, chlorosis, streaking, or other expected symptoms.
  • The overlay is an approximate guide, not a pixel-perfect explanation. It should be read alongside the prediction, not in isolation.

Step 3: Knowledge Layer

  • Each result is paired with crop-specific diagnostic knowledge from the FieldVision knowledge base.
  • This may include common visible symptoms, look-alike conditions, and basic interpretation guidance.
  • The knowledge layer helps users move from "the model focused here" toward "this is what the result may mean in agronomic terms."

These three outputs are designed to be read together. A prediction label alone is not enough. The visual explanation and knowledge layer exist to make the result more understandable and more useful in real agricultural settings.

Visual Explanation

Showing What the Model Saw

FieldVision includes a visual explanation layer for all three crops. The overlay highlights the parts of the image that most influenced the prediction — helping users see where the model focused and whether that matches what they observe in the field.

Rice

Highlights the broad disease regions that drove the prediction on rice leaves. Most useful when symptoms are clearly visible and you want to confirm the model focused on the right area of the leaf.

Tomato

Provides sharper focus on lesion edges and leaf texture. Helps agronomists verify that the model is responding to actual symptom patterns rather than background soil or sky.

Maize

Combines local symptom details with broader disease spread patterns on the leaf. Designed to support field audits, agronomy training, and farmer education in FieldVision deployments.

The visual overlay is an explanation aid, not a diagnosis by itself. It answers one important question: what part of the image influenced this result? It should always be interpreted together with the predicted condition, confidence score, and crop-specific knowledge — not as a standalone signal.

Deployment Status

Where FieldVision Is Used Today

Some models support active field deployments. Others continue in research and pilot use while the evidence base is built out for additional regions and varieties.

Rice

Used for research, ablation studies, and pilot trials. Provides a stable reference point when testing new architectures or comparing approaches for rice leaf diagnosis.

Tomato

Production-ready for tomato-focused deployments. Integrated into FieldVision and partner tools when tomato disease diagnosis is part of the scope.

Maize

The active maize backbone in FieldVision. Model versions are monitored and rolled out in stages as new field data, seasons, and varieties are added.

Deployment environments and hardware targets differ across partners and countries. Model behaviour and limitations remain consistent with what is described on this page.

Limitations & Responsible Use

What FieldVision Cannot Do

Being clear about limitations is as important as describing what works. FieldVision supports agronomic decisions — it does not replace local expertise, field observation, or agronomist judgment.

What the Models Cover

  • Leaf-level diseases and some pest damage for rice, tomato, and maize only.
  • Not designed for weeds, nutrient deficiencies beyond the trained classes, or non-leaf plant organs.
  • Image quality matters. Very blurred, very dark, or extremely small images will affect prediction reliability.

How to Use the Results

  • All outputs are decision-support signals, not final prescriptions. Field observation and agronomic judgment should always accompany the result.
  • Combining model outputs with local field history, seasonal context, and expert advice improves reliability.
  • For high-stakes decisions — especially in new regions or varieties — human review should have the final say.

What We Are Improving

  • Gradual expansion to more crops and conditions, starting where the evidence base is strongest.
  • Better handling of mixed stresses, such as disease appearing alongside nutrient deficiency.
  • Tighter integration between model outputs and localised knowledge bases for more region-specific guidance.

Visual explanations improve transparency, but they do not guarantee correctness. FieldVision is a decision-support system and should be used alongside agronomic judgment, field observation, and local expertise.

Interested in FieldVision or Research Collaboration?

We work with universities, extension services, and research partners on validation, new crops, and low-resource settings. We share behaviour, evaluation approach, and limitations openly while protecting production-critical details.