Transparent ML Research

Machine learning that earns your trust

We believe ML models should be transparent about what they can and cannot do. That means validating datasets before training, showing our work, and being honest when things don't work. This page documents our ML research — including our failures.

Validated datasets only
Open research notebooks
Honest about failures
Universal models for global scale

Our Philosophy

Why we validate data before building models

A sophisticated algorithm trained on bad data produces confident nonsense. Before training any model, we run rigorous statistical tests to verify that real, scientifically meaningful relationships exist in the data.

Core Principle: You cannot extract information that was never encoded

If someone flipped a coin to assign fertilizer labels, no algorithm — no matter how sophisticated — can recover the "true" relationship because there is no true relationship to recover. Data cleaning fixes corrupted signal; it cannot create signal from nothing. This is why we validate every dataset before training.

Test 01 · Mutual Information

Does knowing X reduce uncertainty about Y?

MI = 0 means features tell us nothing about the target. MI > 0.1 indicates some predictive relationship. MI > 0.5 indicates strong signal.

Captures both linear AND nonlinear relationships.

Test 02 · Correlation Analysis

Are there linear relationships?

|r| < 0.1 means negligible relationship. |r| 0.3-0.5 indicates moderate relationship. |r| > 0.5 indicates strong linear correlation.

Example: N application → Yield (r = 0.52).

Test 03 · Chi-Square / ANOVA

Does target depend on features?

p > 0.05 means we cannot reject independence — features and target may be unrelated. p < 0.001 provides strong evidence of real dependence.

Critical for detecting random label assignment.

Test 04 · Model Performance

Can any model beat random guessing?

Classification: Accuracy must exceed 1/num_classes. Regression: R² > 0 means features explain some variance. This is the ultimate "proof in the pudding" test.

5-fold cross-validation ensures robustness.

Case Study: Failure

The fertilizer dataset we had to discard

Transparency means showing failures, not just successes. Here's a dataset we initially planned to use — and why our validation process caught it before it could harm farmers.

Kaggle Fertilizer Prediction Dataset: 100,000 samples, zero signal

This popular Kaggle dataset contains 100,000 observations with soil properties (N, P, K, pH), climate data (temperature, humidity), and 7 fertilizer classes. At first glance, it seemed perfect for training a fertilizer recommendation model. Our validation revealed the truth: the fertilizer labels appear to be randomly assigned with no relationship to the features.

Kaggle Fertilizer Dataset

Mutual Information (max) 0.004
Correlation (max |r|) 0.005
Chi-square p-value 0.66 (independent)
Model accuracy 14.3% = random baseline
Verdict NO SIGNAL

Harvard Yield Dataset

Mutual Information (max) 1.11
Correlation (max |r|) 0.52
ANOVA p-value < 0.001 (dependent)
Model R² 0.68
Verdict STRONG SIGNAL

The evidence: Class distribution reveals random assignment

If fertilizer recommendations were based on soil conditions, we'd expect different fertilizers to be recommended for different soil types. Instead, every fertilizer appears with almost exactly 14.3% frequency (1/7 = random) regardless of soil nitrogen, pH, or any other feature.

# Fertilizer distribution across soil nitrogen levels
# If N predicts fertilizer, distributions should differ

Fertilizer Low N Med-Low N Med-High N High N
──────────────────────────────────────────────────────────
10-26-26 14.3% 14.3% 14.3% 14.6%
14-35-14 14.2% 14.9% 14.4% 14.4%
17-17-17 14.2% 14.1% 14.2% 14.2%
20-20 14.3% 14.2% 14.1% 14.2%
28-28 14.5% 13.8% 14.4% 14.2%
DAP 14.0% 14.3% 14.3% 14.3%
Urea 14.5% 14.4% 14.3% 14.1%

→ All values ≈ 14.3% = Random assignment confirmed

Production Models

Models built on validated agricultural data

After rigorous validation, these models passed our signal tests and provide real predictive value. Each model includes confidence scores, rationale, and links to open research notebooks.

Classification

Crop Recommendation

Random Forest · 22 crops · 2,200 samples

Predicts optimal crop from soil nutrients (N, P, K), pH, temperature, humidity, and rainfall. Returns top-3 recommendations with calibrated confidence scores.

0%
test accuracy (MI = 0.89)
View notebook →
Regression

Yield Prediction

XGBoost · Continuous kg/ha · 12,081 samples

Estimates maize yield based on fertilizer inputs (N, P, K), soil properties, and climate. Trained on Harvard Dataverse Sub-Saharan Africa trials with real agronomic relationships.

R² = 0.00
explained variance (MI = 1.11)
View notebook →
Optimization

Fertilizer Optimizer

Yield Model + Grid Search

Uses the yield prediction model to find optimal N-P-K rates for target yield or budget. Includes economic analysis (cost, revenue, profit) and regional fertilizer product mapping.

Data-driven
optimizes on validated yield model
View notebook →
0
Statistical tests per dataset
0
Open research notebooks
0
Dataset rejected (no signal)

Research Evidence

Model outputs and input relationships

These charts are produced directly from our research notebooks and represent the actual behaviour of our production models. We publish them to be transparent about what our models have and have not learned.

Model Fit

Yield prediction — actual vs predicted

This chart shows whether the model tracks real maize yield behaviour instead of simply memorizing averages. A tighter relationship means stronger predictive value.

Yield prediction model output — actual vs predicted maize yield in kg/ha
Actual vs predicted maize yield in kg/ha
Agronomic Response

Fertilizer response curves — N, P, K vs yield

These response curves help explain how the model expects yield to change as nutrient inputs vary. This is important for making recommendations interpretable.

Fertilizer response curves — how N, P, K inputs affect predicted yield
Fertilizer response curves — nitrogen, phosphorus, potassium, and predicted yield
Feature Influence

Feature importance — yield prediction model

Feature importance shows which inputs most influenced prediction behaviour. This helps expose whether the model is relying on agronomically meaningful variables.

Feature importance chart — which input variables most influence yield predictions
Feature importance — model input variables ranked by influence

Global Scale

Why regression models generalize across borders

A key insight: we use regression (continuous outputs) instead of classification (labels) because plant biology and soil chemistry follow universal laws that don't change at borders.

Key Insight: Train on Kenya data, deploy to Somalia

Classification approach: "Kenya soil type A → Use DAP" cannot generalize to Somalia (no "Somalia" class). 
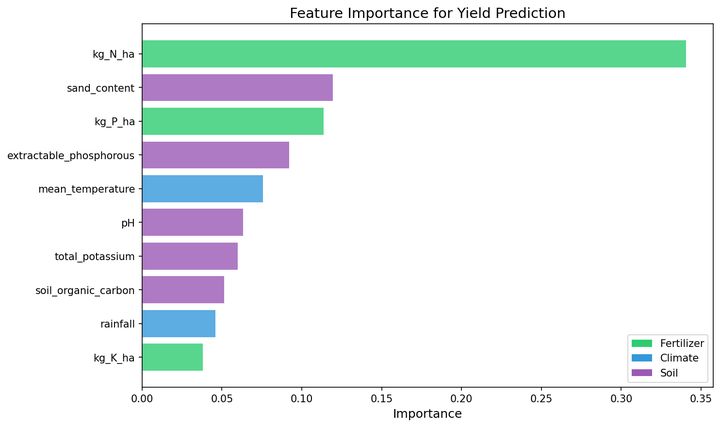
Regression approach: f(N, P, K, rainfall, pH, temp) → yield works everywhere because the model learned universal agronomic relationships, not geographic labels. A maize plant in Somalia responds to nitrogen the same way as a maize plant in Kenya — the underlying biology doesn't change.

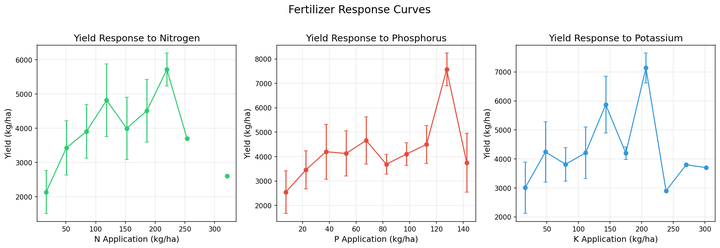
Universal plant biology

Mitscherlich's law of diminishing returns applies everywhere. Nitrogen uptake, phosphorus availability, and potassium dynamics follow the same biochemical pathways regardless of location.

Universal soil chemistry

pH effects on nutrient availability are the same in Somalia as Kenya. Sandy soils leach nutrients the same way globally. Cation exchange capacity follows the same physical laws everywhere.

Universally measurable features

Soil tests work the same everywhere. Weather data is globally available via APIs and satellites. No country-specific features needed — just soil, climate, and management inputs.

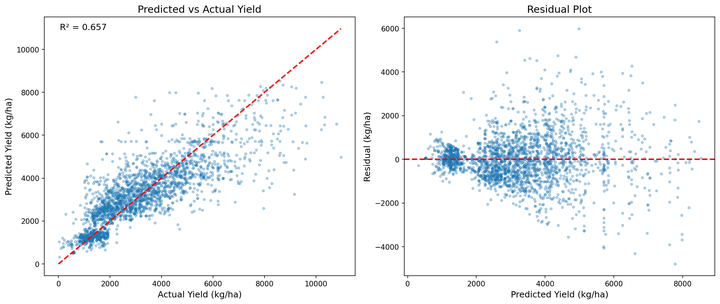
Cross-environment validation: Simulating "new country" predictions

We validated generalization by grouping data by climate/soil environment and testing the model on held-out environments. Even when predicting for "unseen regions," the model maintains predictive power — demonstrating that universal agronomic relationships transfer.

# Cross-validation by environment (simulating new regions)

Fold 1 (Dry/Sandy): R² = 0.27, RMSE = 1,939 kg/ha
Fold 2 (Moderate): R² = 0.25, RMSE = 1,590 kg/ha
Fold 3 (Humid/Clay): R² = 0.27, RMSE = 1,888 kg/ha
Fold 4 (High Rainfall): R² = 0.39, RMSE = 1,504 kg/ha
Fold 5 (Mixed): R² = 0.39, RMSE = 1,318 kg/ha

Mean R² across environments: 0.31 ± 0.06
→ Model maintains predictive power even for "unseen" environments

Transparency

Every prediction comes with rationale and warnings

Unlike opaque AI systems, FildraAI provides structured traces for every prediction: what the model predicts, why it made that prediction, and where to be cautious.

Example: Crop Recommendation Trace

  • Prediction: "RICE" with 95.3% confidence
  • Rationale: "High nitrogen (90 kg/ha), neutral pH (6.5), and moderate rainfall (180mm) strongly indicate rice suitability. Your soil phosphorus (42 kg/ha) is adequate."
  • Alternatives: Chickpea (87.2%), Mungbean (82.1%), Blackgram (76.8%)
  • Warnings: "Consider water availability for paddy rice. If rainfall is unreliable, chickpea may be a safer choice."
  • Model: Random Forest Classifier (99.5% test accuracy, MI validated)
Signal-validated dataset 5-fold cross-validated Calibrated confidence Open notebook
High Confidence (> 90%)
Inputs within training distribution
Model has seen similar conditions; prediction is reliable.
Medium Confidence (70-90%)
Some extrapolation from training data
Use prediction as starting point; verify with local expertise.
Low Confidence (< 70%)
Significant extrapolation or unusual inputs
Treat as rough estimate only; seek expert validation.

Validation Summary

Complete signal analysis for all datasets

Every dataset we use passes rigorous statistical validation. Here's the complete comparison showing why we use some datasets and reject others.

Metric Kaggle Fertilizer Harvard Yield Crop Recommendation
Samples 100,000 12,081 2,200
Mutual Information (max) 0.004 1.11 0.89
Correlation (max |r|) 0.005 0.52 0.45
Independence test p = 0.66 p < 0.001 p < 0.001
Model performance 14% = random R² = 0.68 99.5% acc
Verdict REJECTED PRODUCTION PRODUCTION
Mutual Information > 0.1 required Independence test p < 0.05 required Model must beat random baseline

Boundaries

What these models cannot do

Being transparent about limitations is as important as showcasing capabilities. Here's what our models don't do — and when to rely on local expertise instead.

  • Not a replacement for soil tests: Models work best with actual soil test data. Using regional defaults reduces accuracy significantly.
  • Not a replacement for local regulations: When model guidance conflicts with label limits or national regulations, official documents take priority.
  • Limited crop coverage: Currently validated for maize (yield model) and 22 crops (recommendation model). Other crops require additional validation.
  • Extrapolation warnings: Models flag when predictions are outside their training distribution. These predictions should be treated as rough estimates only.
  • No real-time weather: Current models use seasonal climate data, not real-time weather forecasts. In-season adjustments require additional data sources.
  • Economic assumptions: Profit calculations use default prices that may not reflect local market conditions. Always verify with current local prices.

Responsible use

These models are decision-support tools, not replacements for agronomic expertise. Predictions should be validated against local conditions, farmer experience, and extension officer guidance. We recommend starting with small trial plots before scaling recommendations across entire farms.

Explore our research notebooks

All our ML research is open and reproducible. View the signal analysis, model training, and validation code in Google Colab. We believe transparency builds trust.